Tag: Air Quality
Crop Burning and Air Pollution
From the haze suffered by Singapore every year to the increasing air pollution in rural Asia and Africa and the recent spike of pollution in New Delhi, crop burning is the main culprit in the former and a key contributor in the latter.
Recent research in Europe has shown that smoke from wildfires, agricultural management and prescribed burns raises PM2.5 concentrations and other pollutants even in areas hundreds and thousands of miles from the physical fire. Researchers from Finland estimated that fires between 2005 and 2008 in Europe alone caused more than 2500 premature deaths. The main concern with these landscape fires is that they affect the immediate community but the air quality is detrimentally affected even thousands of miles away, depending on the atmospheric conditions.
This is exactly the case in Singapore, which is regularly affected by smoke haze due to regional forest fires, from agricultural management in Indonesia. Made particularly bad due to the peat soils in the palm plantations which release massive amounts of carbon into the atmosphere. The haze is aggravated by poor precipitation and changes in wind direction. Similarly, New Delhi sees spikes in air pollution due to a mix of crop burning from the adjacent region, excessive firecracker usage during Diwali celebration and specific atmospheric conditions.
According to the Food and Agricultural Organization (FAO), in 2000 it was estimated that 350 million hectares of land were affected by fire. Generally, most fires are caused by people for various agricultural and industrial purposes. FAO considers that greater awareness is needed on the economic and social consequences of crop burning and how to effectively manage it for both individuals and governments.
Although, according to FAO, the region most affected by fires is Africa, Asia has its fair share. The Association of South-East Asian countries (ASEAN) agreed in 2003 on a ‘zero burning policy’ for large scale agricultural businesses. The agreement, which was not signed by Indonesia, included sharing of ‘zero burning’ agricultural techniques and practices, management tools and other mechanisms to ensure ‘zero burning’ practices by large companies. However, the agreement acknowledged that small farmers could not cope with the costs associated with undertaking ‘zero burning’ practices. More than ten years from that agreement, we now know that little has been done for its successful implementation.
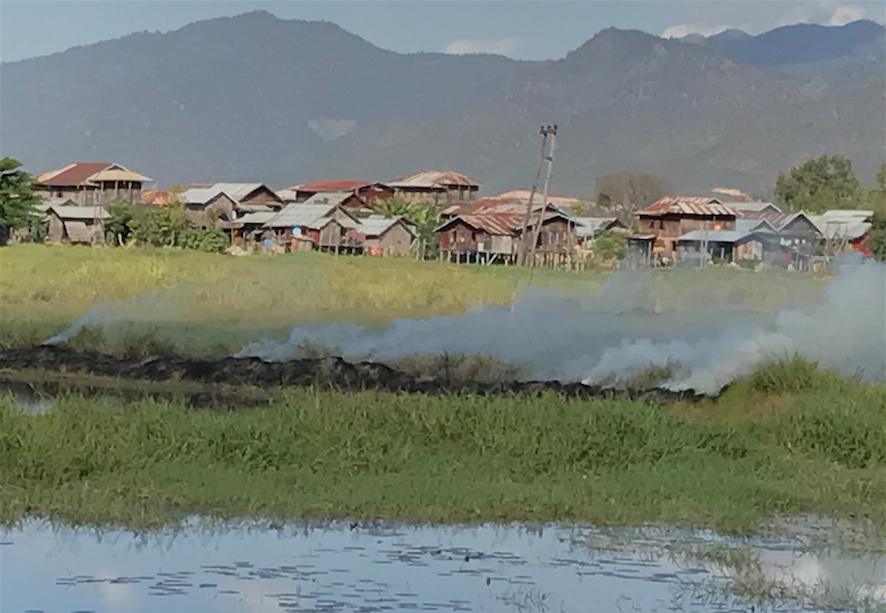
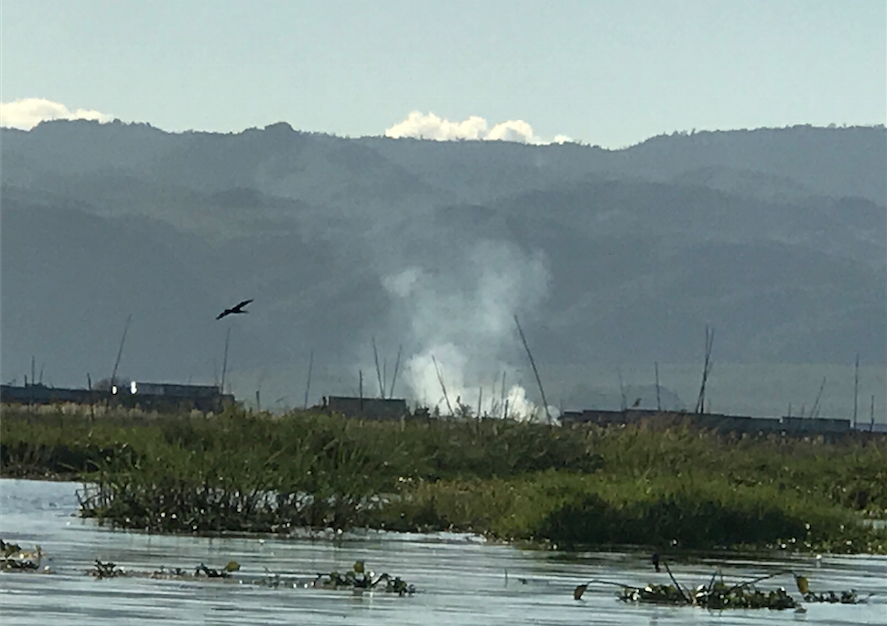
“The lack of government transparency makes it very hard for independent monitoring: concession maps are incomplete, data is lacking and we clearly have weak enforcement of laws,” said Greenpeace South East Asia forest campaigner Yuyun Andrade.
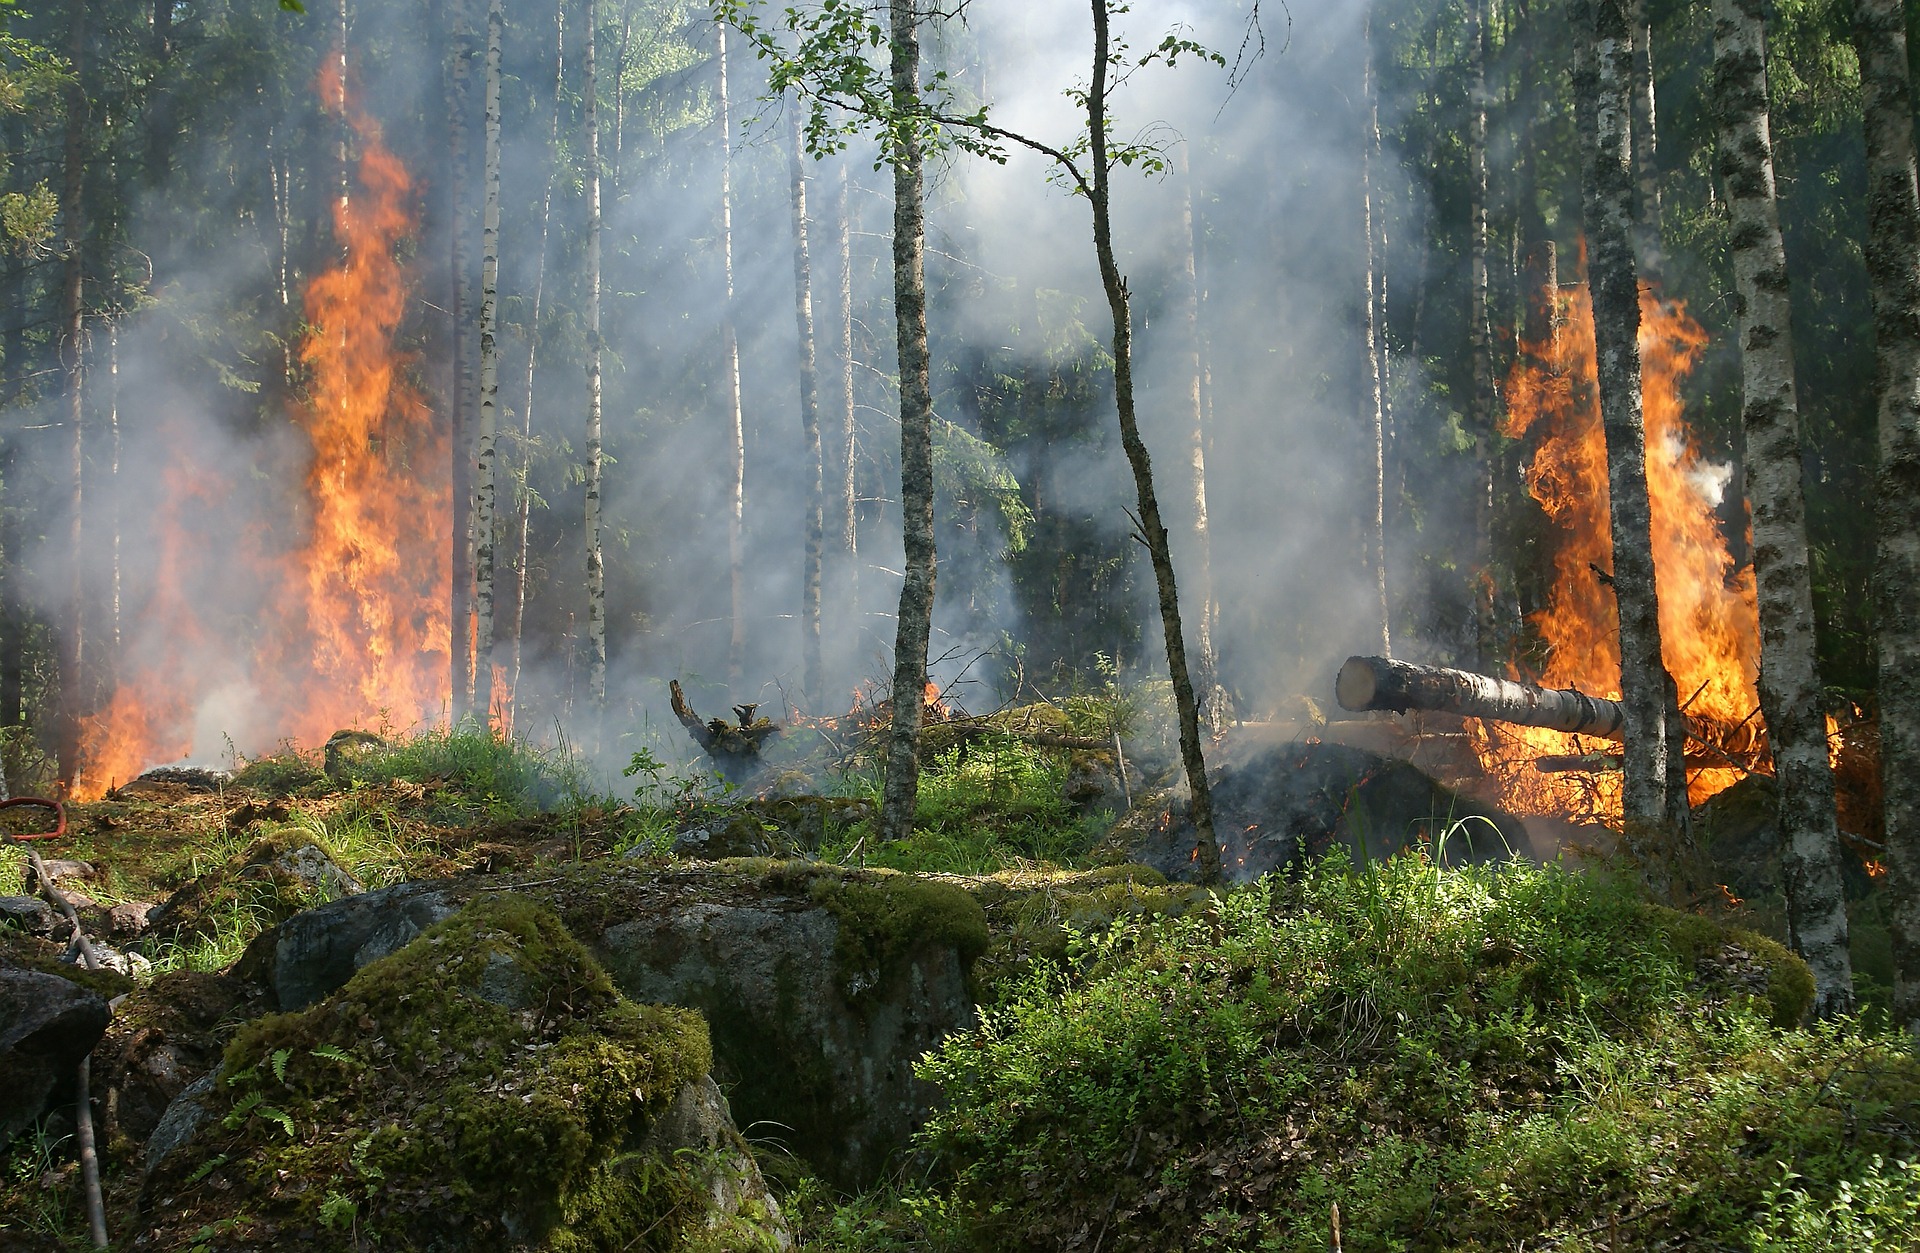
Indonesia has almost 15m hectares of peatland today, between 2000 and 2010 peatland declined by 41% in Sumatra, 90% of that deforestation is believed to have been carried out by palm-oil firms in a region with no monitoring system. Burning peat forests can have a very damaging effect, up to 200 times more than burning any other vegetation.
More precise data and more analysis of data is required to better understand how countries can effectively control crop burning in Asia.
Sources:
Environment Health Perspectives – Fallout from European Fires: An Estimate of Premature Deaths Attributable to Vegetation Smoke
DownToEarth – Crop Burning: Punjab and Haryana’s killer fields
NASA – NASA Sees India’s Punjab State’s Agricultural Fires
National Bureau of Economic Research – Agricultural Fires and Infant Health
Food and Agriculture Organization of the United Nations – Fire management
The Association of Southeast Asian Nations (ASEAN) – Guidelines for the Implementation of the ASEAN Policy on Zero Burning
BBC – South East Asia haze: What is slash-and-burn?
The Economist – Despite tough talk, Indonesia’s government is struggling to stem deforestation
Children and Air Quality in Asia
In October 2016, United Nations Children’s Fund (UNICEF) published the report “Clear the Air for Children” exposing the magnitude of the danger that air pollution poses for children.
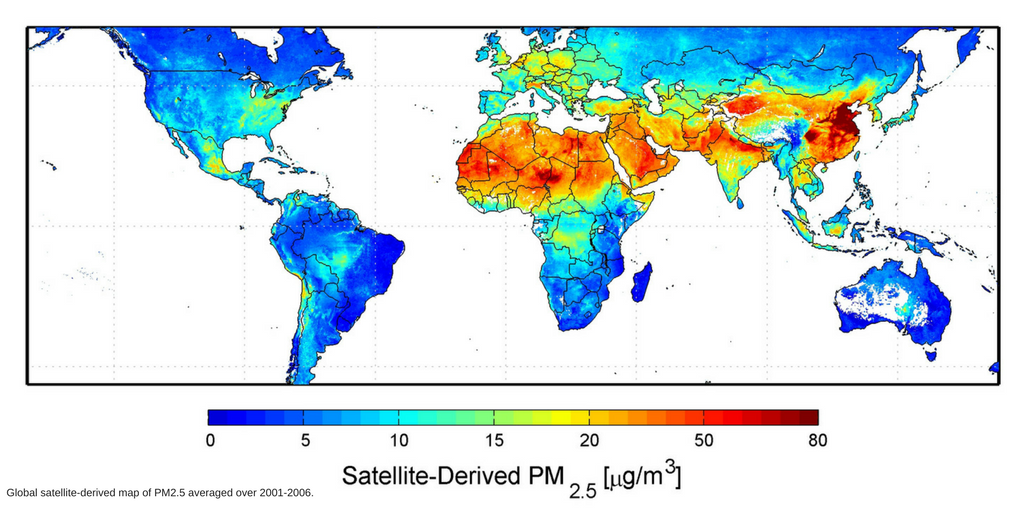
The report shows that, in Asia alone, 300 million children live in areas with toxic levels of outdoor air pollution six times greater than the WHO set standard of 10m/m3 with 1.22 billion children in Asia living in areas that simply exceed WHO standards. Even more alarming, is that these estimates only account for exposure to outdoor air and do not include indoor air pollution. Moreover, UNICEF estimates that every year 600,000 children under-five years old die from diseases caused or aggravated by air pollution and the Organisation for Economic Co-operation and Development (OECD) says these estimates could be 50% higher by 2050.
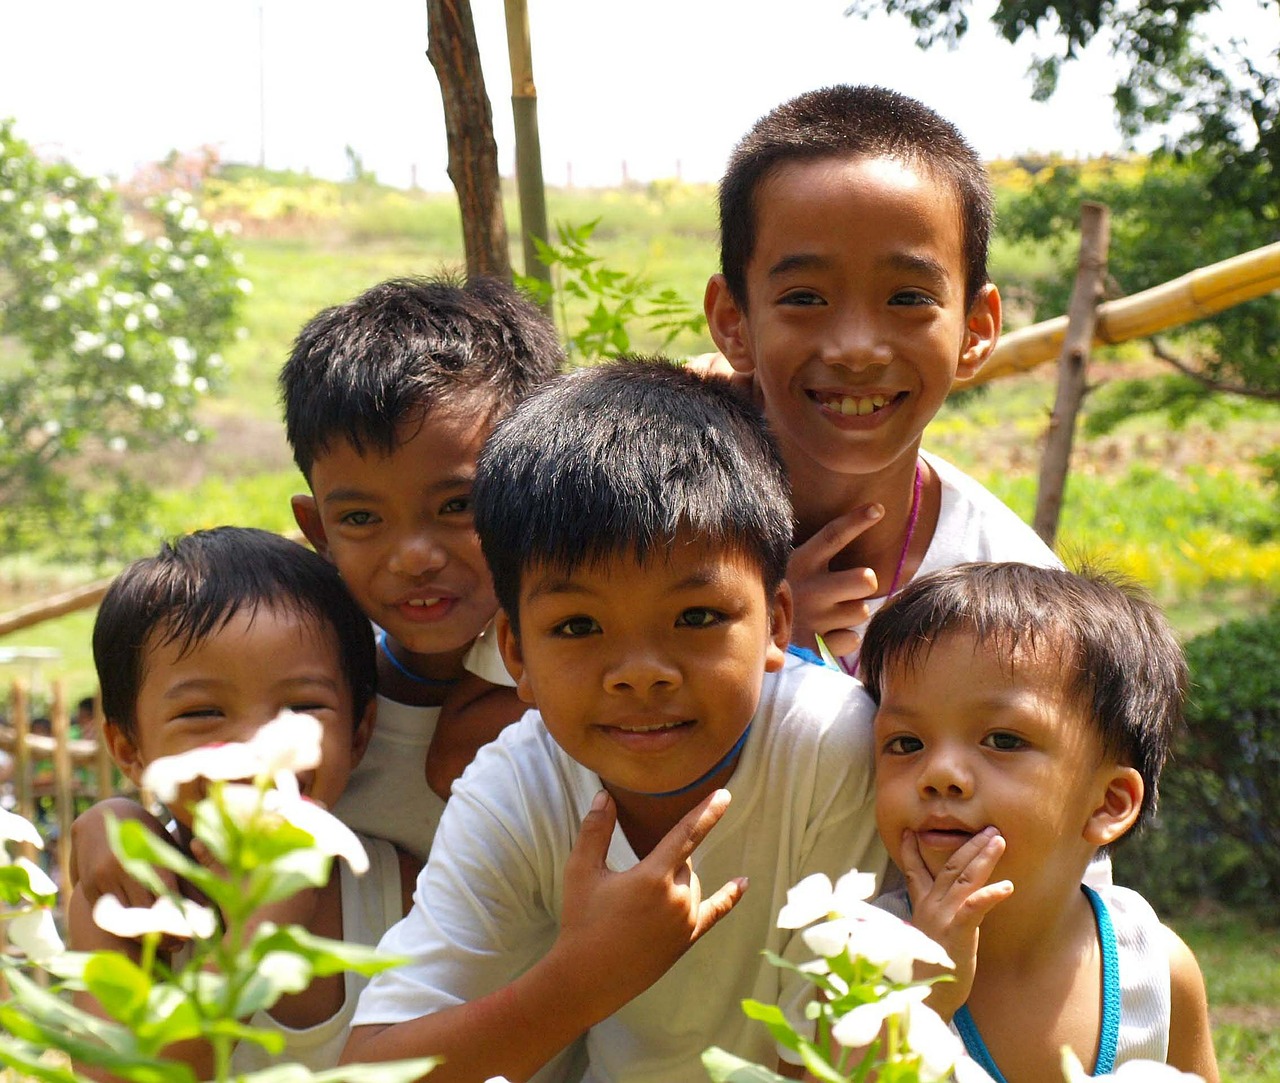
The reason children have a higher exposure when compared to adults is because they breathe twice as fast and their air intake volume is more relative to their body weight. They are vulnerable and exposed to air pollution before they are even born by changes in the placental function. Air pollution can harm their bodies by affecting their developing organs, particularly their respiratory system and their brain. It has also been shown that air pollution can cause cognitive and physical development delays. These negative effects are carried over into their adulthood. Studies have shown that children living in highly polluted areas can have reduced lung capacity by up to 20% and are more likely to have respiratory problems either in childhood or later in life.
In Asia, the situation is bleak. Emissions from factories and vehicles are high and with poor regulation, waste is often burnt, energy is mostly coal-fueled and many households burn biomass for cooking. All combined, the outdoor and indoor air quality tends to be among the worst across the world.
UNICEF comes to four conclusions to protect children from air pollution:
- Increase efforts to reduce air pollution and therefore reduce disease caused by air pollution as well as reduce the threat to children’s health and development. This includes better management of energy generation, waste management, public transportation, technology on vehicle and factory emissions and naturally more information and knowledge.
- Minimize children’s exposure at home, in schools and in those areas where they spend most time.
- Improve children’s overall health to reduce health complications from exposure to air pollution.
- Improve monitoring of air pollution and its link with children’s health.
What can individuals and families do?
- Ensure good ventilation;
- Clean cook stoves;
- Prevent exposure to tobacco smoke;
- Increase knowledge on how to protect themselves; and,
- Better monitor air pollution to better understand time and characteristics of risk.
More air quality monitoring, and more knowledge on air pollution is essential to protect our children!
Source:
Checking air quality where it really matters!
We, at meo, are constantly checking air quality in different places. This article will take us to Hong-Kong, Hollywood road the heart of the bustling city, end of November 2017.
We installed one of our units in Guardian Fitness, a private fitness club, in October 2017. Data were particularly interesting on Wednesday 22nd November 2017, a polluted day, with outdoor PM2.5 at ‘Unhealthy for sensitive groups’ level. Guardian Fitness could be seen as one of the “Safe Heaven” offered to Hong-Kongers, with both PM2.5 and VOC kept in the “Green” zone.
PM2.5 refers to the small particles that we inhale when we breathe. They are tiny enough to go through your lungs, and enter your bloodstream triggering health reactions.
VOC refers to the gases exhaled by new furniture, new carpets, new mats, new paints … each time there is renovation ongoing, or when standard cleaning products are used, as they contain a lot of unhealthy chemicals.
Now, you know that you have 2 good reasons to join the lessons at Guardian Fitness:
Fitness and clean air!
Meo air analytics Available NOW in Hong Kong, Singapore and France!
Are you pregnant? We’ve got you covered! Tips to protect your bump from Air Pollution

Air pollution is ubiquitous and our desire to have offspring is natural….well at least for some of us! Today we want to bring to you a few facts on what is known about exposure to air pollution during pregnancy for you and your bump. Here are some useful and easy to follow safety tips.
Let’s start with the facts:
Research has shown that prenatal exposure to pollutants can increase the risk of low birth weight and preterm delivery, which contributes to infant mortality and developmental disabilities. We are usually concerned about outdoor air pollution: ozone, particulate matter etc but other pollutants of concern that we should always keep in mind are those mostly present indoors, such as household cleaners, fumes from paint and carbon monoxide in addition to particulate matter that is present indoors.
Some research has shown that particulate matter affects the fetal development because it alters the intrauterine environment. This ‘early-life’ stress is a contributor to conditions that will increase the risk of cardiovascular disease, cognitive function, diabetes, obesity and problems in the nervous system later in life.
“Healthy pregnancies in women result in healthy children. Healthy children make healthy adults, societies and nations.” Dr Sherin Devaskar, Mattel Executive Endowed Chair of the department of pediatrics at Mattel Children’s Hospital UCLA

Source:
Policies: the debated carbon tax
Following COP21 and the Paris Agreement governments representing 96% of global greenhouse emissions (GHG) and 98% of the world’s population committed to reduce their emissions. They now need to ensure businesses and individuals use energy with less GHG emissions.
Currently there are two market-based options to encourage lower emissions based on higher costs for polluting industries: the carbon tax and cap-and-trade schemes (ETS). The carbon tax is a levy on the production, distribution and use of fossil fuels based on the amount of carbon emitted in that specific process, which is then translated into a tax on electricity, natural gas or oil. This system is built to encourage businesses and individuals to consume less energy or do it more efficiently, the more electricity they use the higher its cost. Therefore, the carbon tax policy encourages the use of less electricity by improving efficiency and at the same time it also makes green energy more price-competitive.
How do governments price carbon?
They put together all the costs caused by carbon emissions, such as healthcare costs, agricultural costs and others; and they tie them to the carbon used per year. It makes those responsible for the emission, responsible for the external costs of that emission too, and signals the need to reduce emissions or pay for it.
Technically, we have advanced considerably in carbon tax policies. The Paris Agreement has been a stepping stone to increase carbon pricing initiatives across the globe, in its Article 6 the Agreement provides a basis to facilitate carbon pricing. And according to the World Bank, 40 countries and more than 20 cities, states and provinces use carbon pricing –they account for 13% of annual global greenhouse emissions. Now 100 countries additional –accounting for 58% of global GHG- are planning or considering carbon pricing policies. Many of these initiatives are at a very early stage, but nonetheless they have taken that positive step which can then be the beginning of a more aggressive pricing strategy. The most promising advance for this coming year is that China is expected to implement its ETS. This would be the largest increase of GHG covered by carbon pricing.
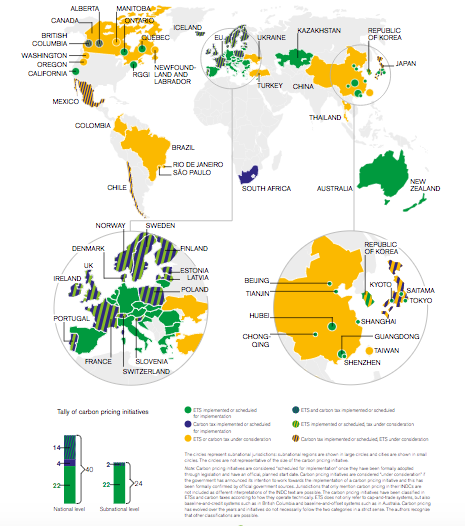
However, the reality of many regions of the world and notably of Asia shows just how challenging this can be and why these policy efforts are sometimes not felt in the actual air we breathe.
In Asia, change could translate to significantly lower global carbon emissions. Because Asia is the largest emitter – 33% of the global emissions are generated in Asia where China alone uses more coal than the rest of the world combined, any successful implementation of policies can have a huge impact globally. However, the challenge is big. India, Indonesia, Pakistan, Bangladesh and other Asian countries have a growing demand for electricity to meet their developmental needs -expected to double by 2030- and plans for this expansion rely heavily on coal fueled electricity. Nonetheless, China has a great interest to change their carbon emission trends and has set the target to peak carbon emissions by 2030 and increasing the non-fossil fuel to 20% by 2030. Similarly, India, Vietnam and Bangladesh are actively working to increase the use of renewables in the energy mix. The question is how can the solar energy or wind energy projects in all these countries be scaled-up to represent a larger portion of the national energy mix.
What can businesses and individuals do?
A quote by an American Author seems relevant at this point.
“I am only one, but I am one. I cannot do everything, but I can do something. And I will not let what I cannot do interfere with what I can do.”
― Edward Everett Hale
Strive for energy efficiency because you can!
Sources:
HowStuffWorks – How Carbon Tax Works
The World Bank – Pricing Carbon
The World Bank – Asia Can Help Lead the Way to Climate Change
The World Bank – State and Trends of Carbon Pricing 2016
Ministry for the Environment – Ministerial Declaration on Carbon Markets
Climate Central – The West’s Largest Coal Plant May Close.It’s a Big Deal.
State of Global Air 2017
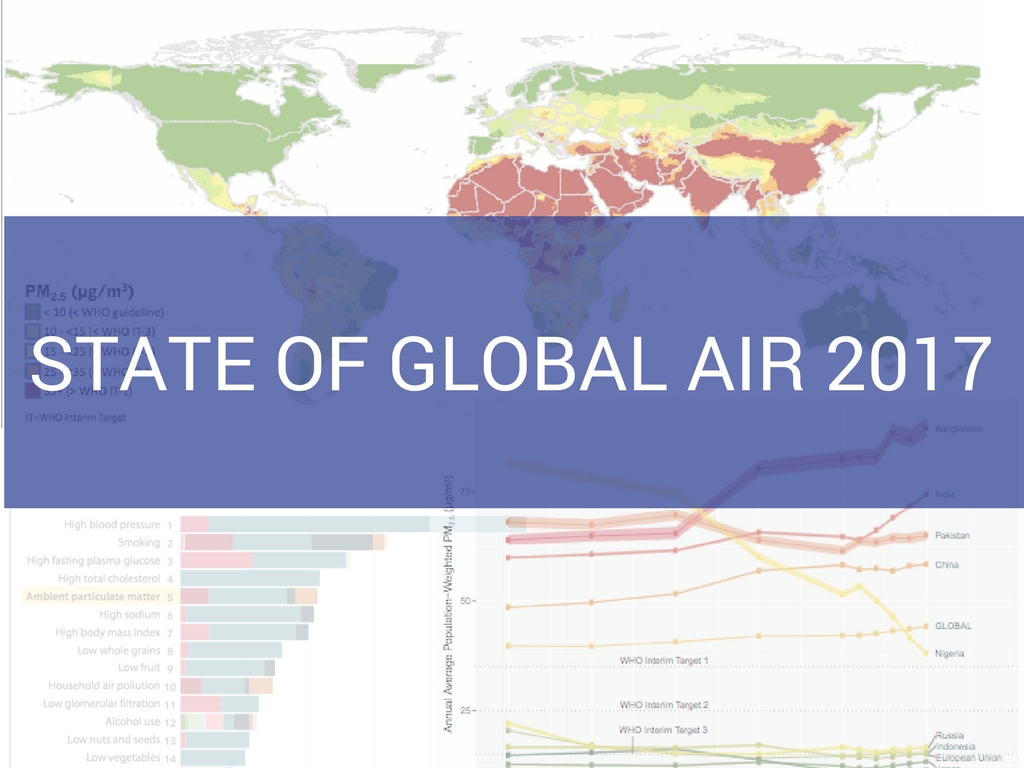
The University of Columbia, the Institute for Health Metrics and Evaluation (IHME) and the Health Effects Institute (HEI) recently published a special report on global exposure to air pollution and its effect on disease. The IHME is an independent health research center from the University of Washington and the HEI is a non-profit independent research organization that has, since 1980, been promoting / publishing impartial science on the effects of air pollution.
The objective of this report is to build on the Global Burden of Disease Study (GBD), which is the most comprehensive study worldwide that describes causes of mortality, major diseases, injuries and other factors that are a risk to health in a national, regional and global perspective. The latest publication by the GBD in 2015 reported that exposure to PM2.5 is the 5th biggest contributor to mortality and disease globally and accounts for 4.2 million deaths from heart disease, stroke, lung cancer, chronic lung disease and respiratory infections. Their recommendation is to continue tracking and analyzing pollution and PM2.5 in order to better understand how to reduce this burden on the health system and society as a whole.

The State of Global Air report highlights several important messages that we summarize here with some illustrative charts:
- A number of institutions are researching air pollution and its effects on health. WHO estimated that, in 2012, 3 million people died from PM2.5 exposure, GBD says 4.2 million.While there may be discrepancies in the number based on methods of estimation and source of data, all research parties agree that the impact of PM2.5 is substantial and growing in importance.
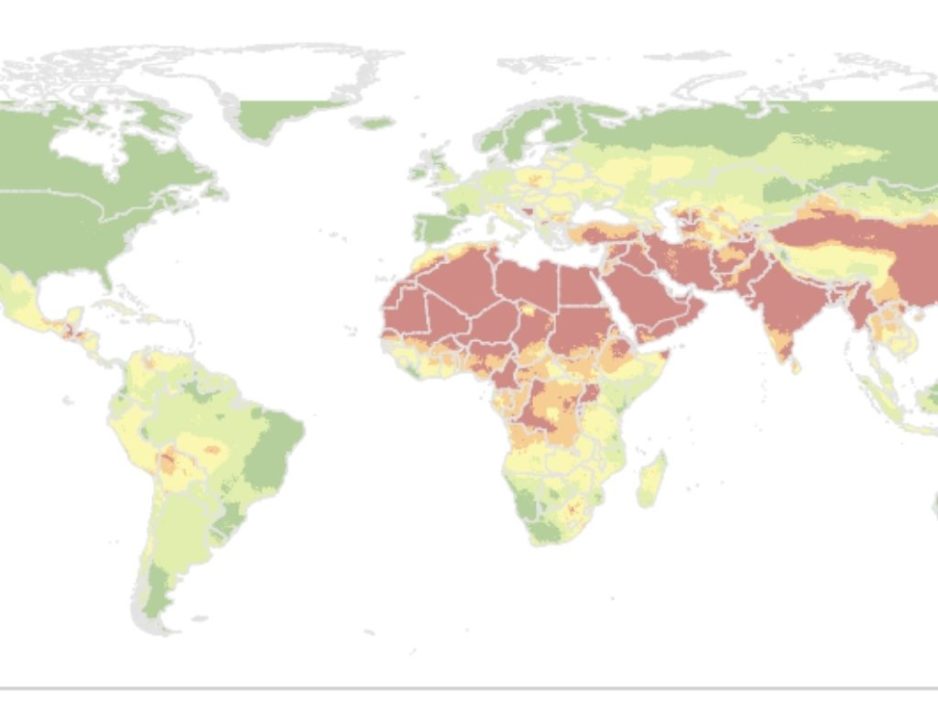
- The most affected regions are Asia and Africa, as seen in the chart here.

- Since 2010, the number of deaths and disease due to PM 2.5 has been increasing rapidly. Interestingly in China, the change escalated between 1990 and 2010 and has now plateaued.
- Bangladesh and India are experiencing the largest increase since 2010, in the order of 50%-60% increase in the 5 years to 2015.
- Disparities among countries have also grown: less-polluted areas are now cleaner, whereas PM concentrations have increased in the most polluted areas. Some of these trends are shown in the chart here.

- In 2015, long term exposure to PM2.5 contributed to 4.2 million deaths costing 103 million years of healthy life with 52% of this happening in China and India. The financial and social cost to society is huge.
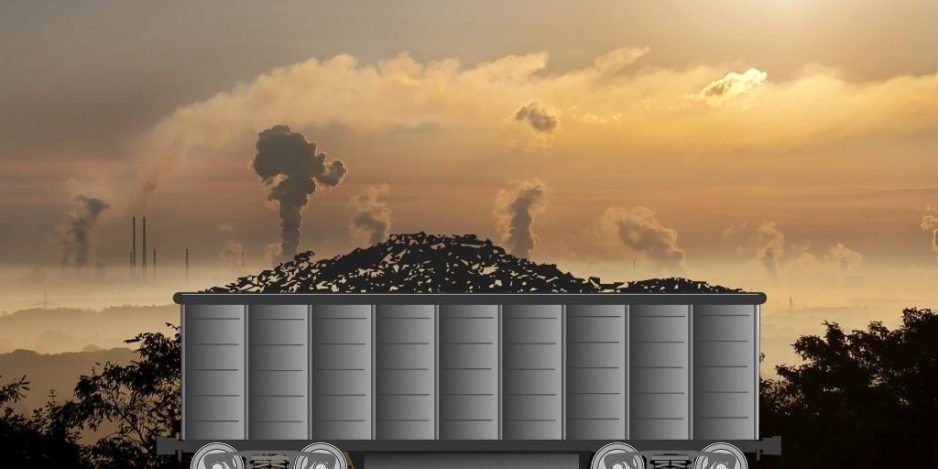
- Coal-burning by industry, power plants and home heating creates 40% of PM2.5 exposure as shown in the chart here.
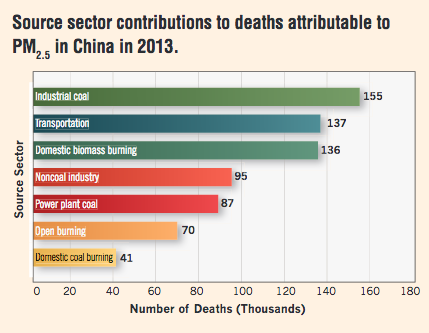
This report is issued yearly building on the GBD reports and making available new data. The 2018 report expects to share successful stories from cities and countries across the world on how they have improved air quality and public health.
In the interim, the most important is to continue collecting data on air quality and making changes in your day-to-day lives to improve the air you breathe.
Air quality data helps us to understand trends and visualize potential solutions. blue aims to help users do just this and we are looking forward to launching our product in the market soon.
If you want to explore the data more in detail, change the comparative countries or just learn more, go to: https://www.stateofglobalair.org/report
Source of information and graphics:
State of Global Air 2017. HEI, 2017. www.stateofglobalair.org. Data source: Global Burden of Disease Study 2015. IHME, 2016. (Accessed 02/27/2017).


